Understand your campaign numbers
Find a campaign's sent, replies and reply rate, and read them honestly. Opens and clicks are not tracked.
You will have read how a campaign is doing and know what each figure can and cannot tell you.
Steps
- Open Email outreach, then Campaigns. Each row shows leads, emails sent, replies, reply rate and the interested count.
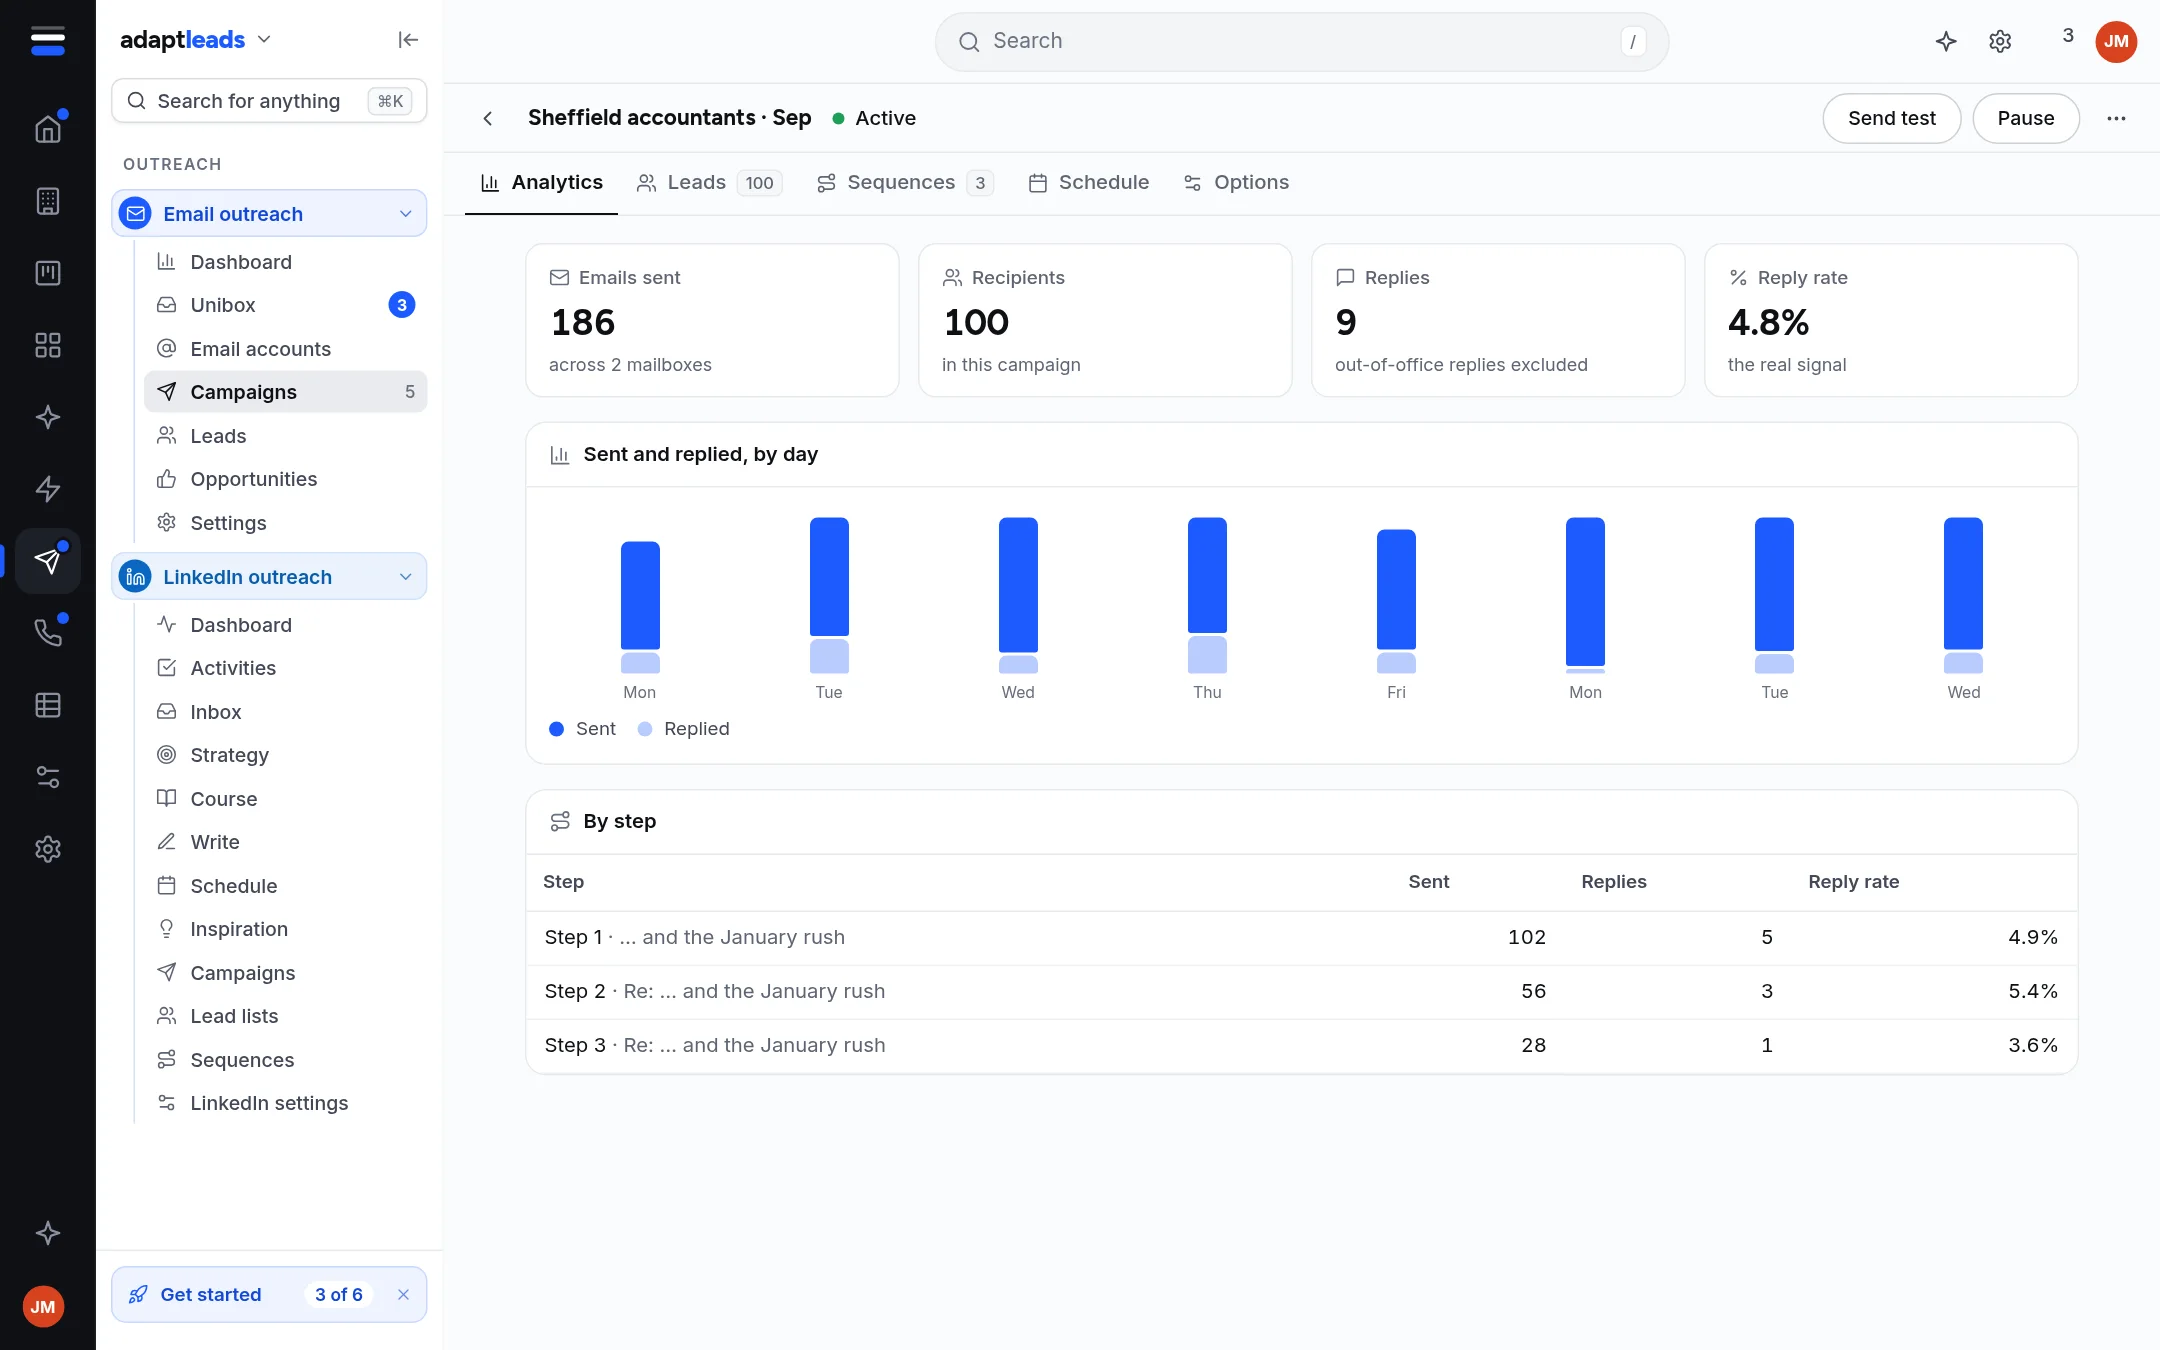
- Click a row for the side panel, or open the campaign and click Analytics. It shows emails sent, recipients, replies and reply rate.
- For all your campaigns together, open the Email outreach dashboard.
- To keep the figures, click Export on the dashboard. You get a spreadsheet with each campaign's status, recipients, emails sent, replies, reply rate and interested replies.
How to read them
- Reply rate is replies divided by emails sent, all time. An out-of-office counts as a reply.
- A rate of 4% on 200 emails is eight replies. That is too few to draw firm conclusions.
- A reply that says no still counts as a reply. Interested counts replies tagged Interested or Meeting booked.
- Tags are the app's reading and can be wrong.
- Did not deliver counts replies tagged as a bounce, read from bounce notices that reach your inboxes. A high number damages your reputation: see Bounces and email status labels.
What you will not find
Opens and clicks are not tracked, to protect deliverability. A reply rate is the honest signal. These are shown as Not counted yet: emails sent by day, delivered, spam reports, best time to send, and which email of a sequence got a reply.
What to do with them
If bounces rise, pause and clean the list: Pause an email campaign. If replies are low, look at the first email and who you sent it to. Raise the daily limit slowly.
Every figure and how it is worked out is in Reports and what the numbers mean.