Analytics: how your market is changing
Tiles that count businesses with a kind of news, month by month, each saying what it counted and out of how many.
Analytics counts how many businesses had each kind of news, and shows it month by month where Adapt can count it honestly.
Open Adapt Insights then Analytics. The page title is How your market is changing. Every figure says what was counted and how many businesses it is out of. It shows what happened, never why.
A new account
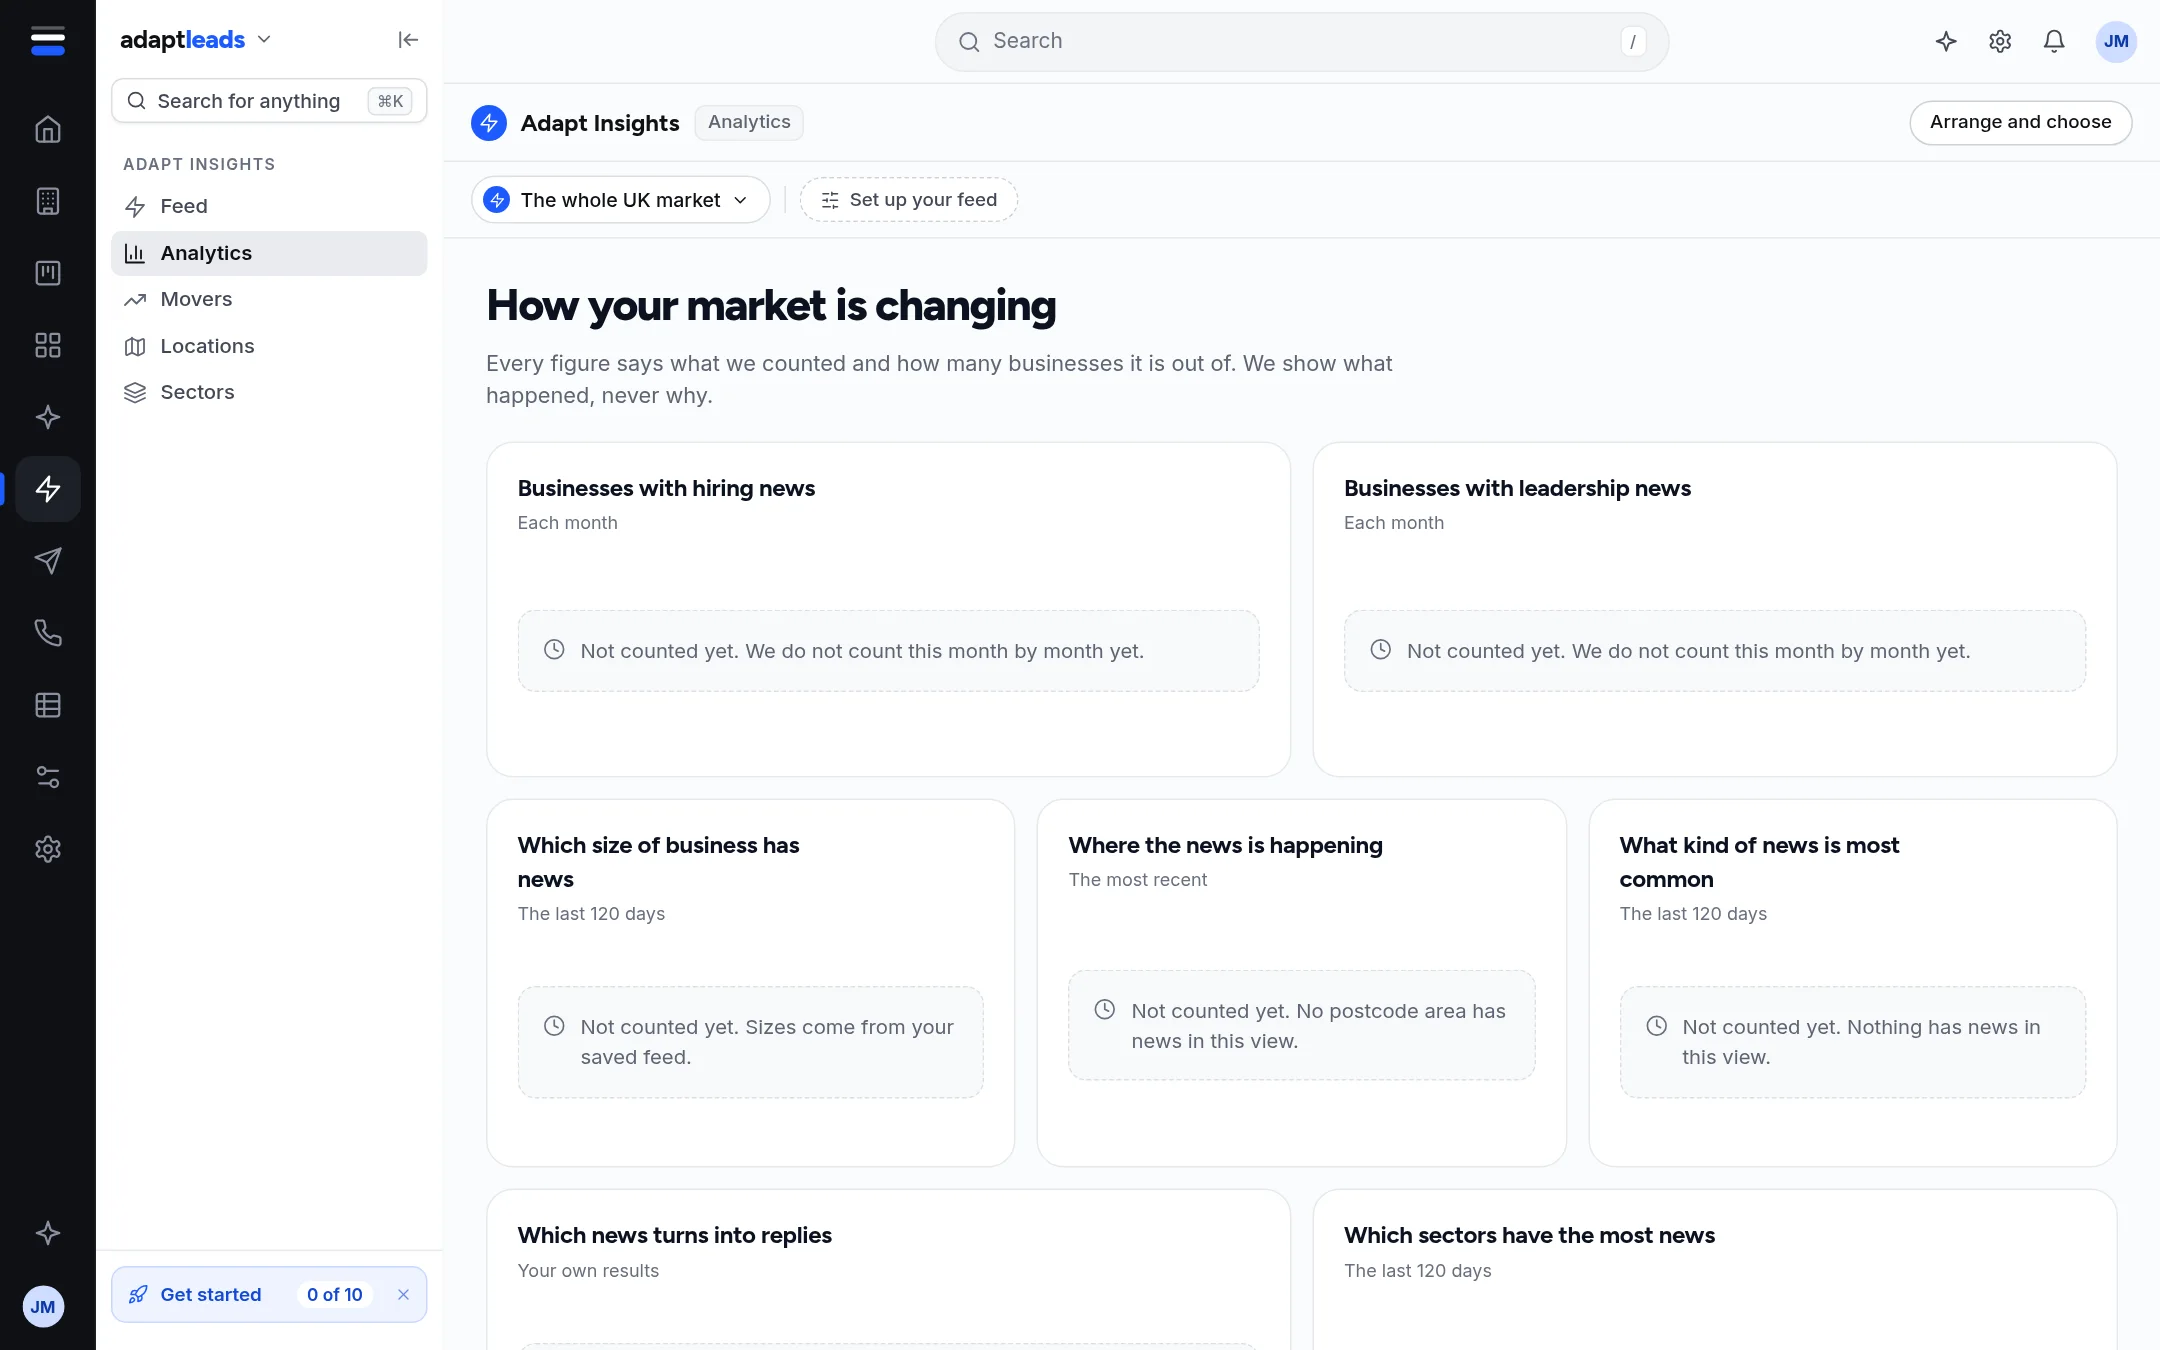
On a new account with no feed, the page shows the whole UK market and each tile either has a chart or says Not counted yet with the reason. Set up your feed to count your own market: see Set up your feed: who you sell to, and where.
With data
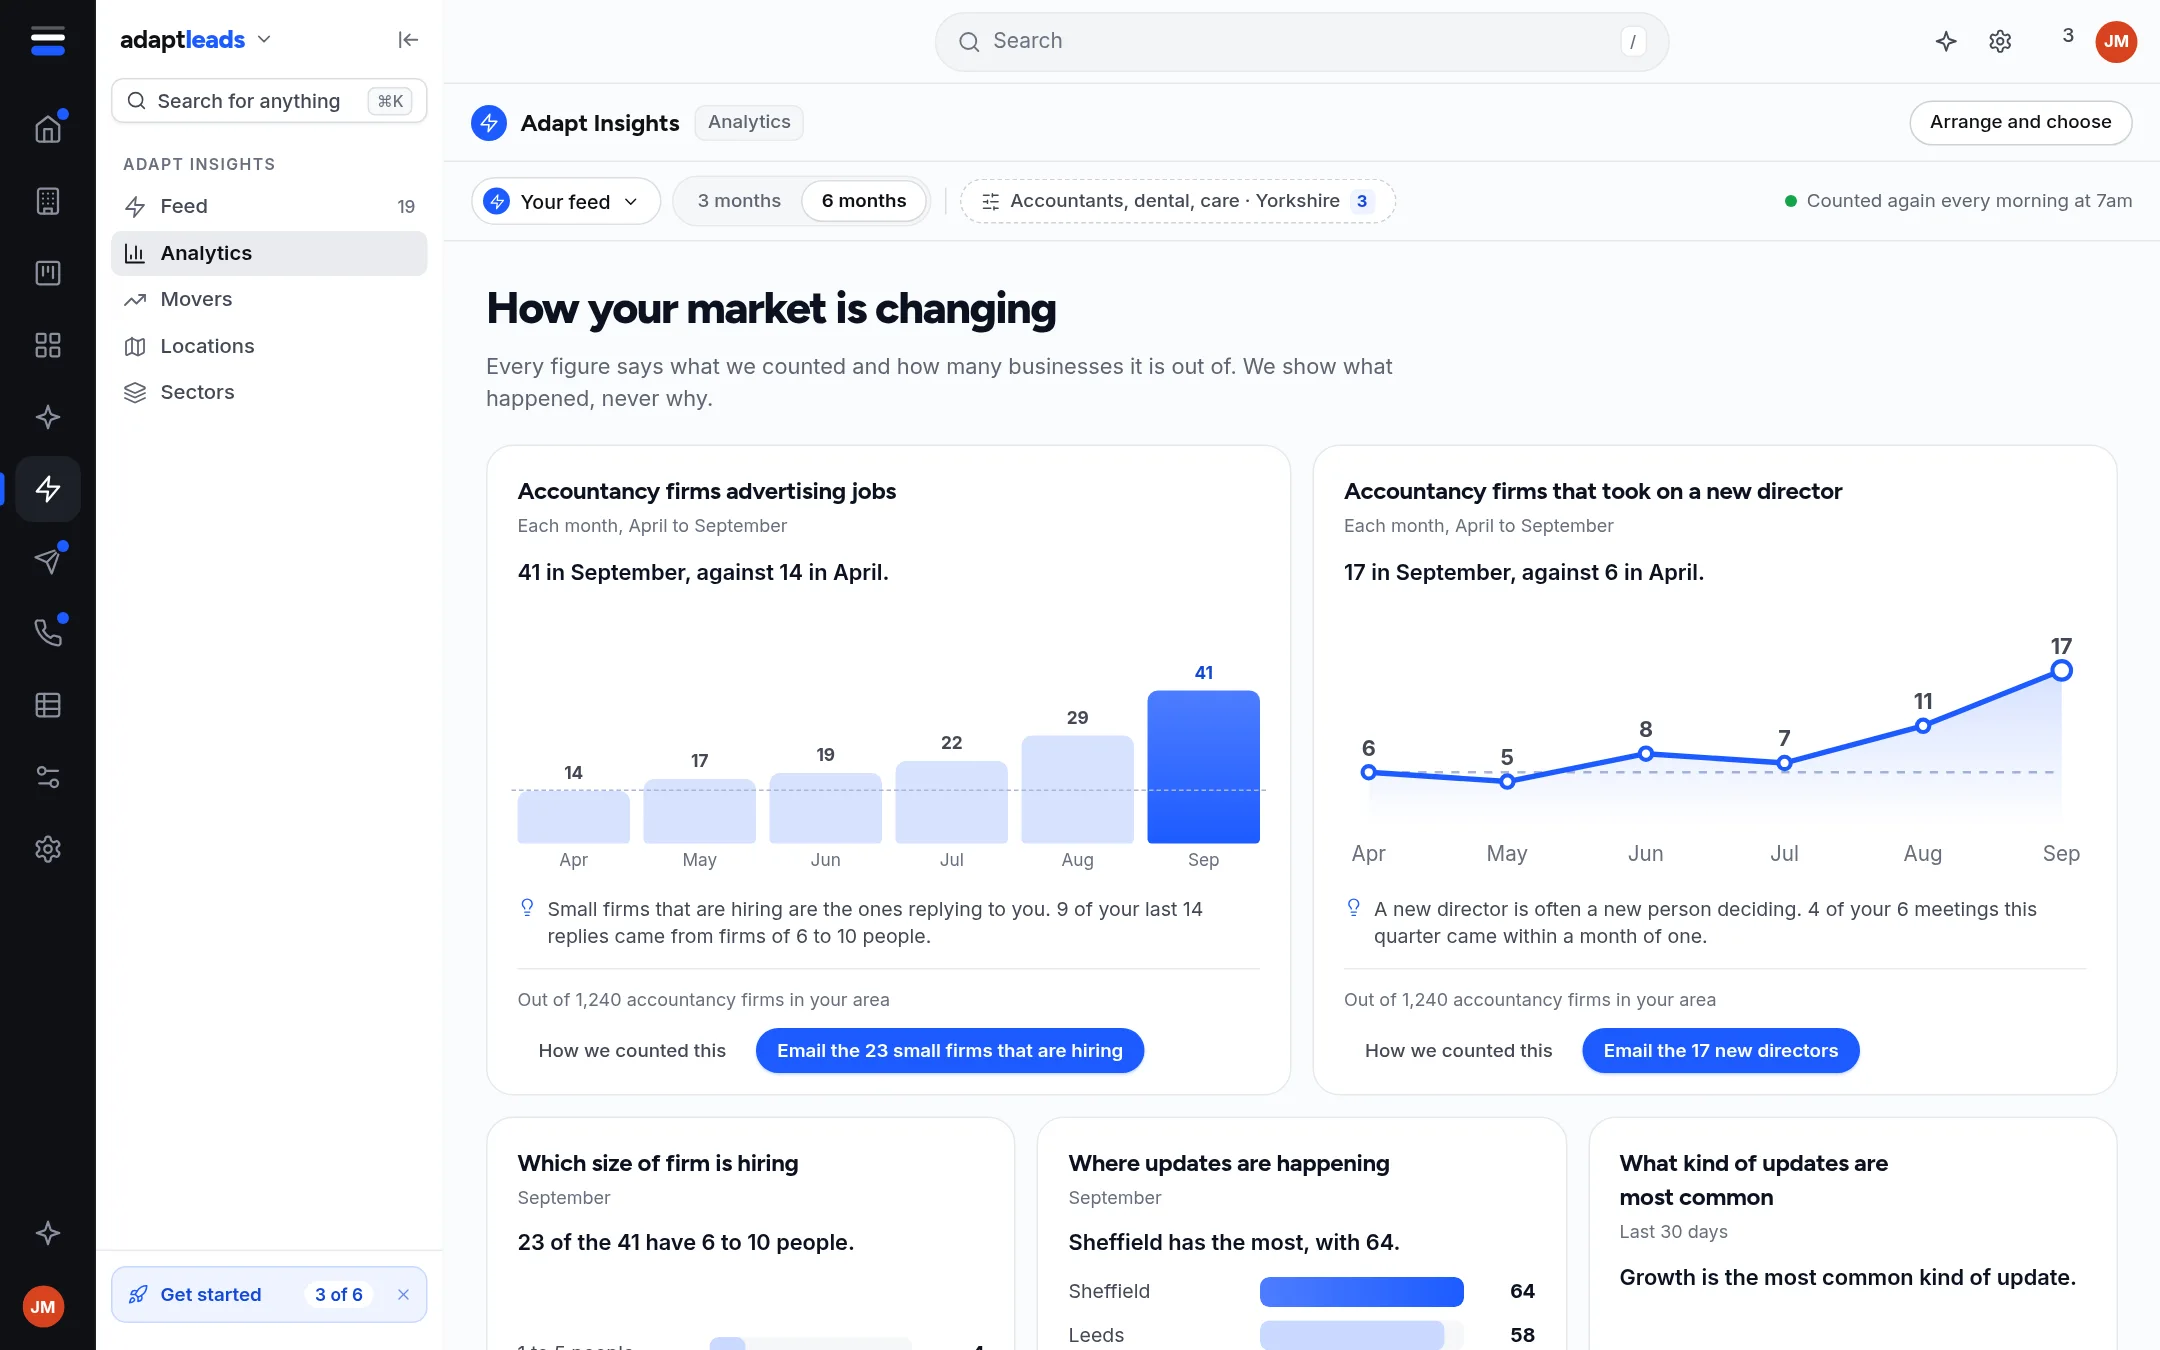
The picture is the sample world. Your charts will show your own sectors and months.
The tiles
| Tile | What it counts | Counted? |
|---|---|---|
| Businesses with hiring news | Businesses with a job advert or hiring story each month | Monthly, where enough months are read |
| Businesses with leadership news | Leadership stories each month | Monthly, where enough months are read |
| Businesses with expansion news | Expansion stories each month | Monthly, where enough months are read |
| Businesses that filed a different trade | Register changes of trade, by month | Monthly, where read |
| Businesses that won a contract | Contract awards by month | Monthly, where read |
| Businesses with insolvency news | Insolvency stories by month | Monthly, where read |
| Which size of business has news | Businesses with news of the kinds you watch, by staff numbers, last 120 days | From a saved feed |
| Where the news is happening | The most recent businesses with news, by postcode area | Yes |
| What kind of news is most common | Signals by group, last 120 days | Yes |
| Which sectors have the most news | Businesses with news, by sector | Yes |
| Businesses listed as a supplier's partner | Needs the date each business joined a partner list | Not counted yet |
| Which news turns into replies | Replies tied to the news that prompted the email | Not counted yet |
| Which businesses are likely to hire again | Needs 12 months of counting | Not available yet |
| Which months are busiest | Needs a full year of counting | Not available yet |
How a month is counted
A business counts for a month if it has at least one event of that kind whose real date falls in that month. Adapt counts a kind for a month only when the book holds at least 20 businesses with it that month. Below that the month was not read properly, and the tile says Not counted yet instead of drawing a chart that would show our collection, not the market. The month still open is drawn apart from whole months, with the date it is counted to. A tile needs at least three months in a row to say a finding.
Click How we counted this on a tile to see what it counted, what it is out of, over what period, how a month is dated and when it was last counted. Monthly tiles are kept for an hour.
Arrange and choose
Arrange and choose lets you move tiles, turn them off and add others. The arrangement is saved in this browser only, so it will not follow you to another computer.
Where the view comes from
The switch at the top chooses Your feed or The whole UK market. The chip beside it opens your feed setup.
What it does not show
Reply rates tied to news, change since last month for a sector, and any "why". See known-issues/insights.