Reports
Reports shows real figures from your account: pipeline, replies, companies added, email, LinkedIn and exports.
Reports (side menu, Home area) shows only figures Adapt can really read. The page says "Nothing on this page is estimated."
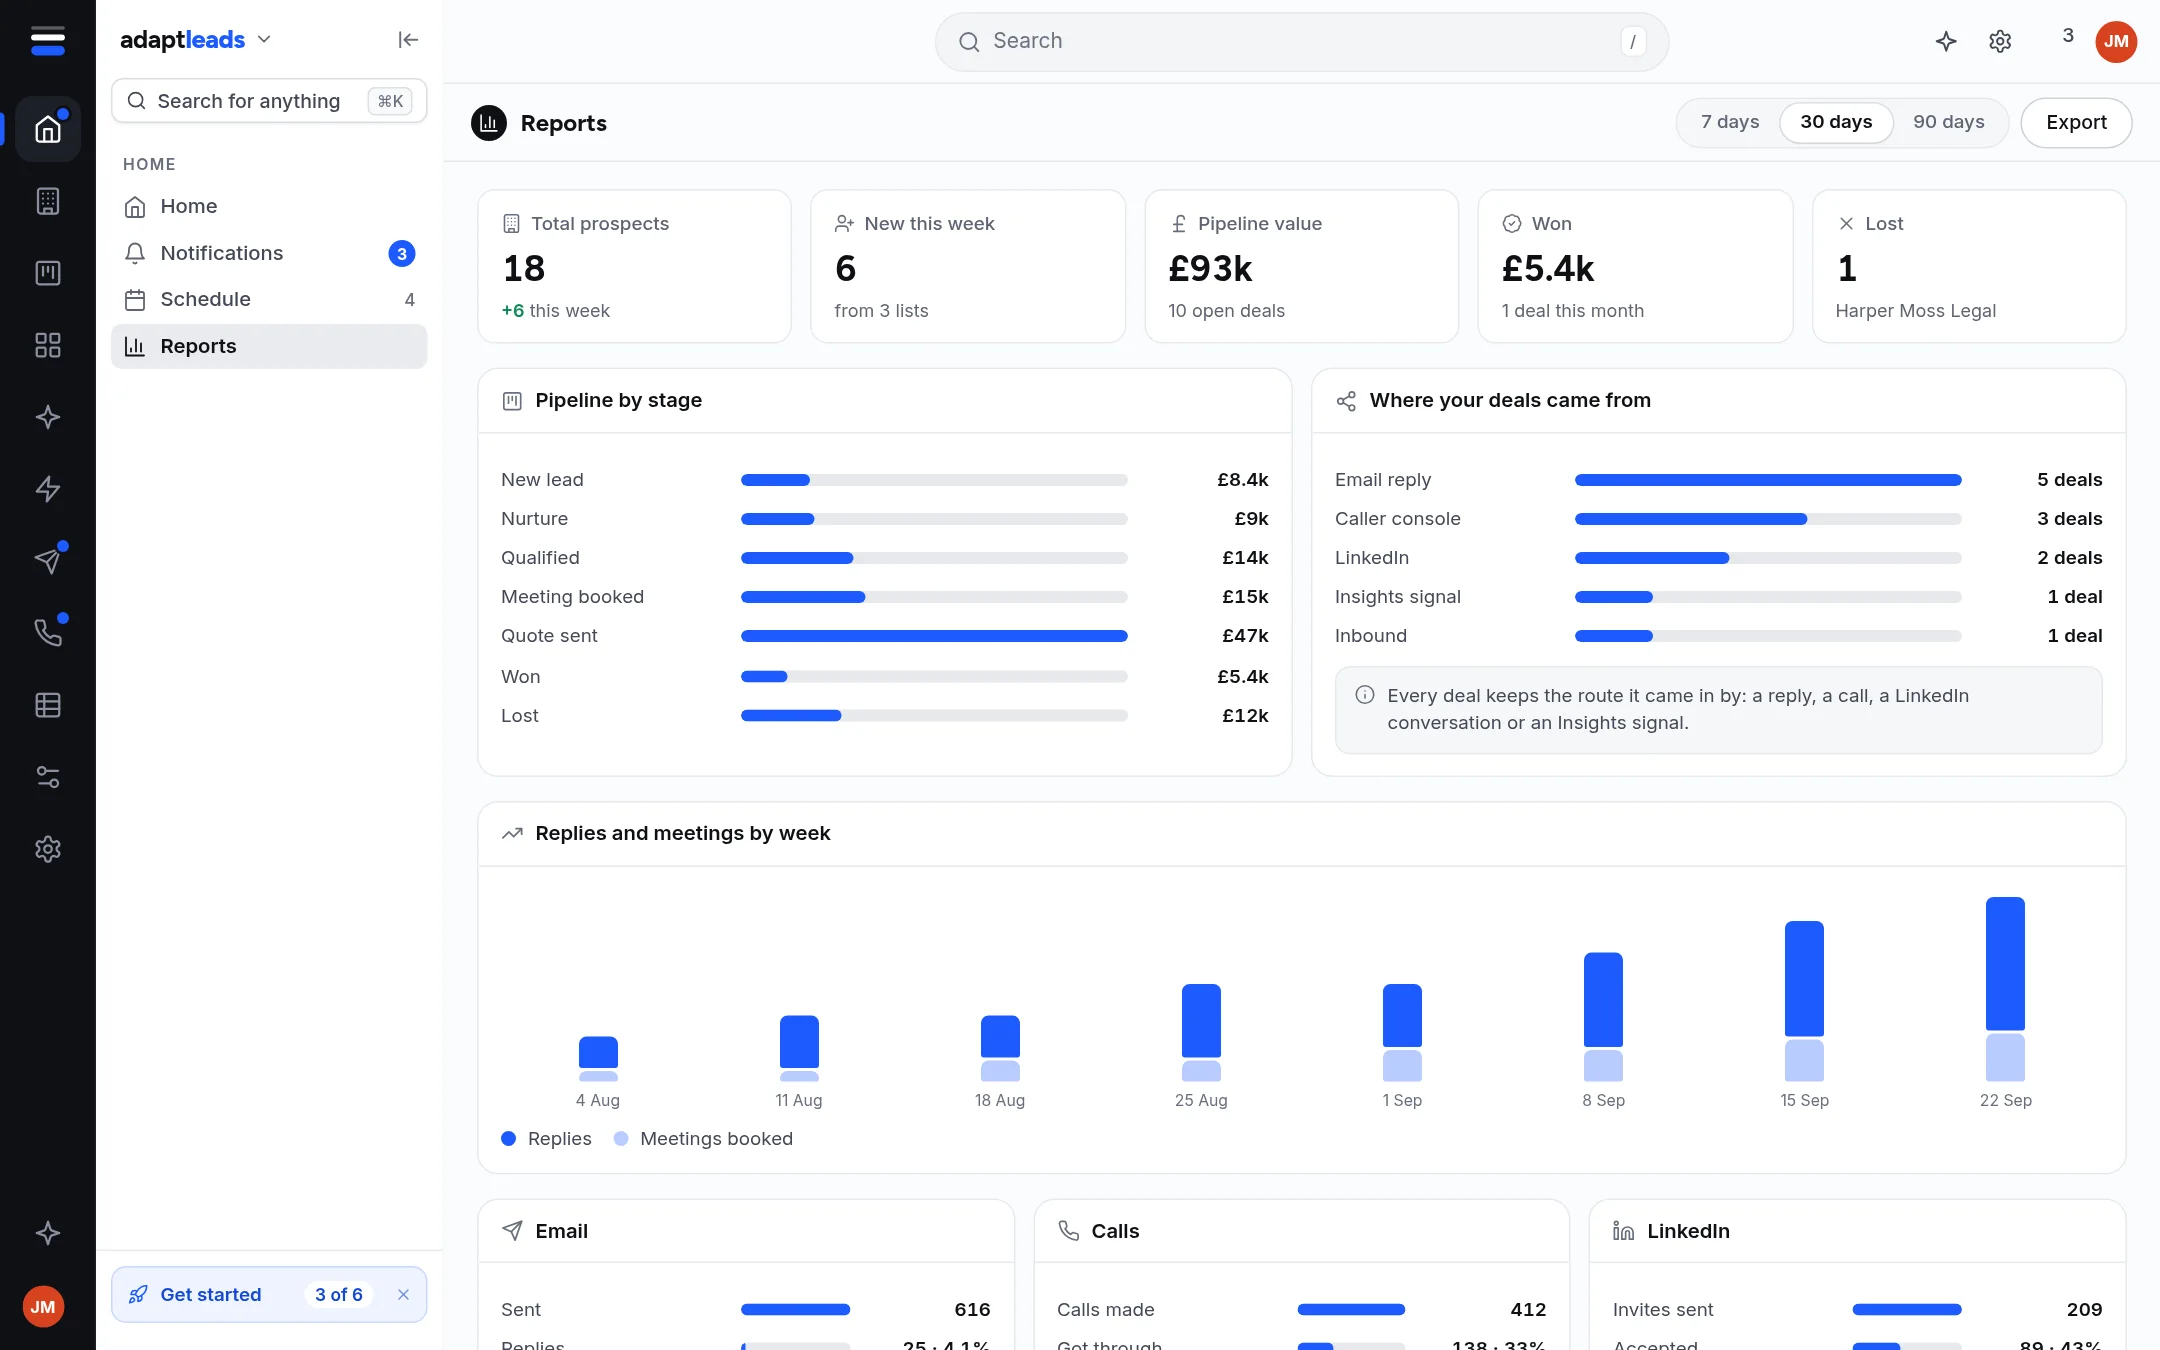
What is on it
| Part | What it shows |
|---|---|
| Top figures | Companies you hold, New this week, Pipeline value, Won, and Exports used with how many are left of your allowance. |
| Pipeline by stage | Your opportunities by stage, by value or count. |
| What people replied | A count of reply labels: Interested, Question, Not interested and so on. |
| Replies by day or week | A bar chart for the range you pick (7, 30 or 90 days). |
| Companies added | A 30-day chart of companies added to your records. |
| Email, LinkedIn | Totals to date: emails sent, replies, opportunities; LinkedIn invites sent, accepted and replied. |
| Calls | Not connected: "The caller console is not connected to reports yet." |
| Account ledger | Recent account activity. |
The range changes the replies chart only. Sent, replies, opportunities and LinkedIn are totals to date. Companies added covers the last 30 days.
Export
Press Export to download a CSV of the headline figures, named adapt-leads-report-DATE.csv. It does not use your export allowance, because it holds figures, not contacts.
Needs
Email and reply figures need Adapt Outreach. Without it those panels say so.